The definitive ecosystem design toolkit

The ecosystem design toolkit helps startups, enterprises and organizations establish ecosystem-based business models by helping them determine key stakeholders, incentivization models and value flows.

The toolkit is available on Miroverse: https://miro.com/miroverse/ecosystem-design-toolkit-v100/

For a decentralized ecosystem to survive, each stakeholder must feel incentivized to play an active role. We believe utility is the deciding factor toward creating self-sustainable token value. Our ecosystem-oriented service design process will help you define that value.

What is ecosystem design?

Ecosystem design is a methodology for the design of decentralized business models.

In a centralized business model, the decision-making process, resource allocation, and overall direction of the business are controlled from a single point. As the name implies, decentralization shifts power and control in a collective direction.

Ecosystem members are a mutually dependent group who collectively produce value to improve the ecosystem. The members can be individuals, groups, businesses, or organizations alike.

Typical examples of decentralized ecosystems are peer-to-peer networks and token-based Web3 services.

However, the level of decentralization and centralization doesn’t change like an on-off switch. Rather, it is more similar to a slider between the two. The correct setting is different for each ecosystem, which is determined by in an ecosystem design process.

Why is ecosystem design needed?

In the current Web2 climate, companies use service design principles to build products that users enjoy spending their time with.

Business models that are based on ecosystems require similar design knowledge. However, the relationship between different stakeholders is more interconnected and complex, requiring an approach called ecosystem design.

By understanding the connection between stakeholders, it becomes possible to build a self-sustaining ecosystem. This understanding is fundamental to the ecosystem’s success as it makes it clearer to move on to the following steps like deciding on the correct technical architecture.

The ecosystem design process is valuable because it reminds us that the emphasis should be on the end-users of the technology, not just the technology itself.

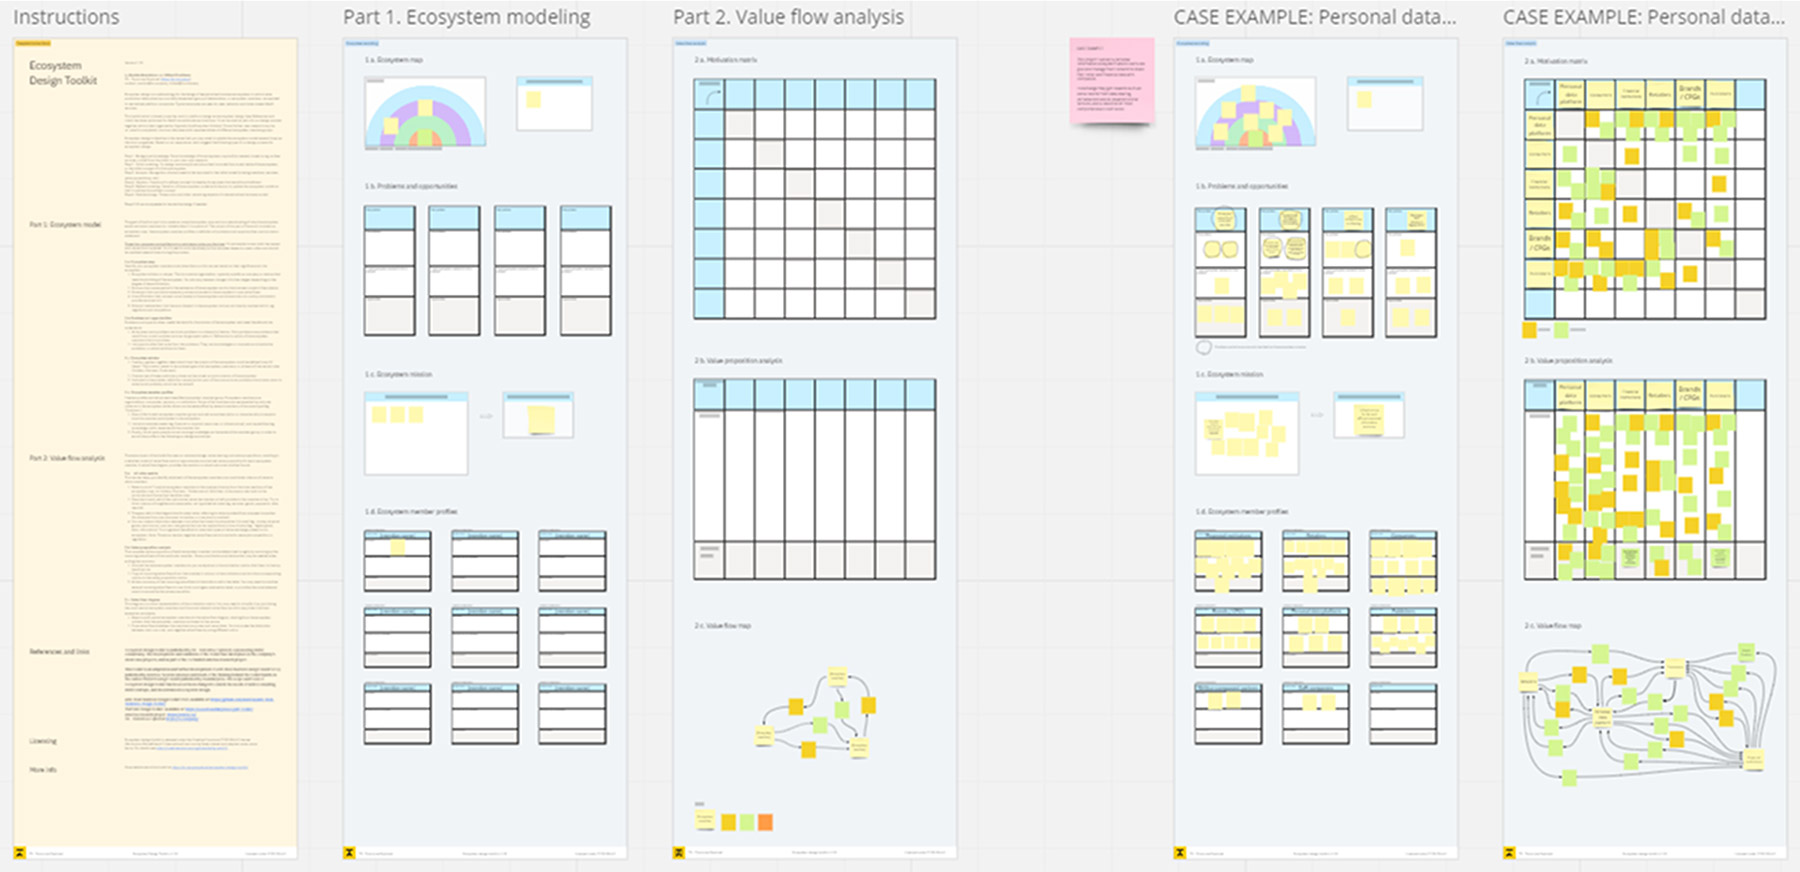
Miro board
Overview of the ecosystem design toolkit, version 1.0

How to design an ecosystem?

We have compiled an ecosystem design toolkit to help anyone create self-sustaining ecosystems. It contains seven tried and tested tools suitable for all ecosystem-based business models, which are especially prominent in Web3 development.

The tools have been developed during TX’s work with real clients and scientific research as part of the EU-funded ATARCA project. The toolkit is optimized for consultancies and businesses looking to establish ecosystem-based business models.

You can use the toolkit in a co-design process together with the client organization, which is typically the ecosystem’s initiator. To fully leverage the tools, you may need to engage in additional user research, such as interviews with different ecosystem member groups.

What is ecosystem modeling?

Ecosystem modeling is the first part of the ecosystem design process.

The aim is to gain an understanding of why the ecosystem exists and what members, or stakeholders, it consists of.

The outputs in ecosystem modeling include the ecosystem map, the ecosystem member profiles, a definition of their problems and opportunities, and a mission statement.

As the different tools are connected to each other, you may have to revisit and update them during each revision cycle.

Ecosystem modeling instructions

Watch the video below to get a full tour of each tool, including an example of the case study included in the toolkit. You can also read the instructions for each tool separately.

1. Motivation matrix

The motivation matrix canvas helps to identify how each ecosystem member contributes to another member. Try to select members only from the most central sections of the ecosystem map, the initiator, partners and collaborators.

As you will notice later, each new member will make the ecosystem’s value flow mapping much more complex.

  1. First, select up to six or seven central ecosystem members for analysis. Add them in the same order in both the horizontal and vertical headline rows.
  2. Describe in each cell of the matrix what value a member on the left provides to a member at the top. Try to think in terms of tangible and measurable value, not only hypothetical value. These could include things like services, goods, data, tools, and knowledge.
  3. The gray cells in the diagonal are for peer value, referring to value provided from one peer to another. For example, one consumer to another or one retailer to another. In your case, these might remain empty.

You can also make a distinction between rival and non-rival goods. Rival goods lose value when used, like money, physical items or work hours. Non-rival goods can be used without a loss of value, like digital goods, data or information. To put it more tangibly, a rival good can be a piece of cake. Once eaten, nobody else gets to have it. A non-rival good could be sharing the recipe for the cake so others may also make and enjoy a tasty piece of cake.

You can add negative value flows, which involve, for example, competition or regulation.
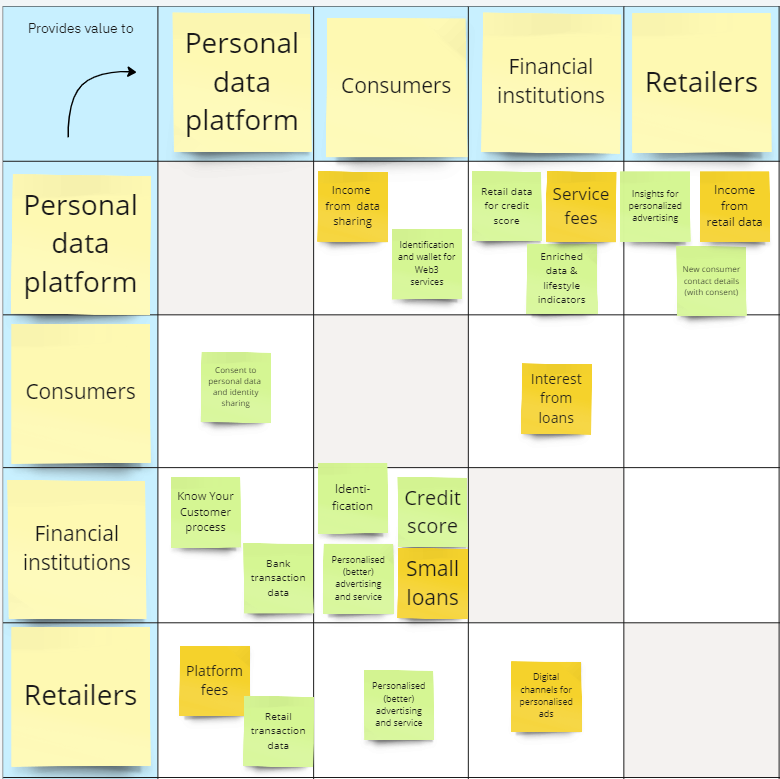
Motivation matrix
Motivation matrix filled by case example.

2. Value proposition analysis

The complete value proposition analysis can be determined roughly by summing up the incoming value flows for each ecosystem member. You may have to prioritize or abstract information when writing a summary for each member.

  1. Fill the analysis table using the same ecosystem members from the previous motivation matrix. Add those members to the top headline row.
  2. Copy all the incoming value flows from that member’s column into the motivation matrix to the corresponding column in the value proposition matrix.
  3. Write brief summaries in the final row about the incoming value flows for each ecosystem member. You may need to combine several incoming value flows into one, think on a higher abstraction level, or prioritize the most relevant flows to be able to summarize the value proposition.
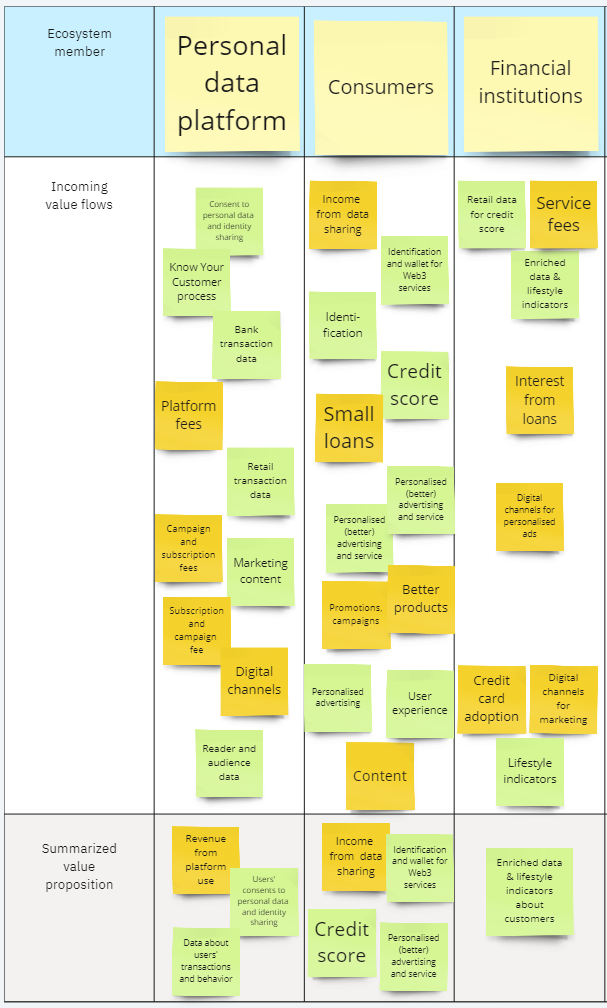
Value proposition analysis
Value proposition analysis filled by case example.

3. Value flow diagram

The value flow diagram is a visual representation of the motivation matrix. You may need to simplify the matrix by prioritizing the most central ecosystem members and the most relevant value flows to avoid drawing an excessively complex map.

  1. Select one to five key ecosystem members, starting from the ecosystem initiator. Add the ecosystem members as sticky notes on the canvas.
  2. Draw the value flows between the members as arrows and give them a name if necessary.
  3. You can also make the distinction between rival, non-rival and negative value flows by using different colors for the sticky notes.
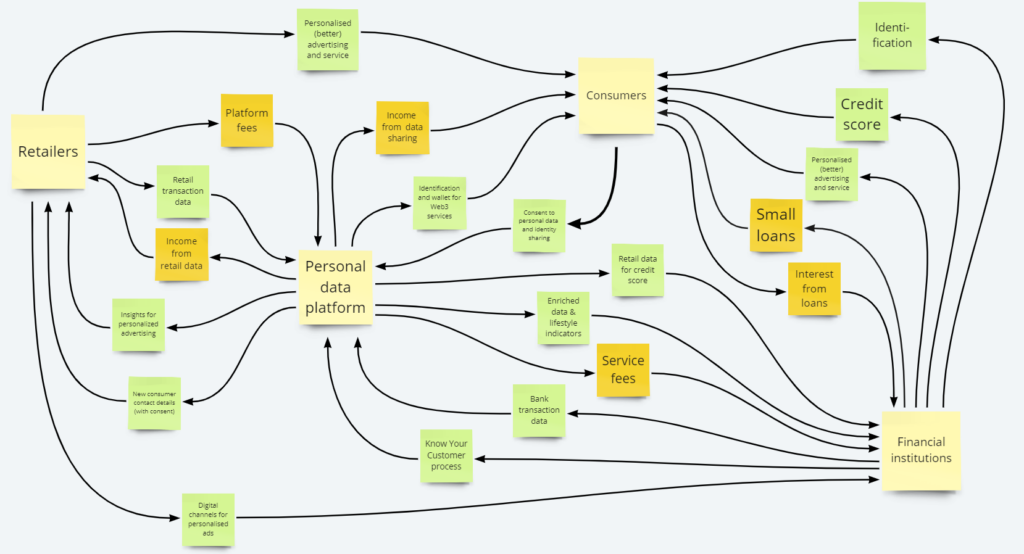
Value flow map
Value flow map drawn in case example.

Contact us

Join forward-thinking companies that are setting a new standard in digital business. Whether you're launching a new venture, scaling a B-brand, or transforming an existing operation, TX is here to drive your success.

Book a time with Jarmo
Or drop us a message and we will get back to you as soon as possible.

This site is protected by reCAPTCHA and the Google  Privacy Policy and Terms of Service apply.